Every year millions of people put money into a project that is not their own: an album to record, a hospital to equip, a business to launch, a neighbour to help. Lined up, the numbers behind this simple gesture tell one of the most fascinating economic stories of the last fifteen years. We have gathered them all here, straight from the original sources: universities, supervisory authorities and the platforms’ own official reports.
$113.7bn
online alternative finance worldwide in 2020, all models
Cambridge Centre for Alternative Finance
$40bn
raised on GoFundMe since 2010, the largest donation platform
GoFundMe
$1.25bn
reward-based crowdfunding worldwide in 2020, up 43% in two years
Cambridge Centre for Alternative Finance
€4.25bn
investment crowdfunding in the European Union in 2024
ESMA
€45.4m
reward and donation crowdfunding in Italy in 2025, more than four times 2016
Politecnico di Milano
239
authorised crowdfunding platforms active in the EU, across 23 countries
ESMA register, 7 November 2026
Crowdfunding
Raising money for a project from many people, usually through an online platform. Backers may receive a reward, nothing at all (donation), a stake in the company (equity) or their money back with interest (lending).
One caveat before anything else, because it shapes everything that follows: crowdfunding has no single counter. The Cambridge Centre for Alternative Finance surveyed the whole world up to 2020, then stopped. Since 2025 ESMA, the European markets authority, has published data on investment crowdfunding, but not on reward or donation. In Italy the Politecnico di Milano tracks investment crowdfunding every year and also estimates reward and donation. Every number on this page tells you which source it comes from, and the full list is at the bottom.
The four models
One word covers four very different things. The difference comes down to a single question, and it decides everything: what does the person putting in the money get back?
| Model | Backers receive | Rules in the EU | World 2020 |
|---|---|---|---|
| Reward | an object, an experience, a copy of the finished work | e-commerce, VAT, consumer protection | $1.25bn |
| Donation | nothing, except knowing they helped | no dedicated rules | $7.0bn |
| Equity | a stake in the company | Regulation (EU) 2020/1503 | $1.52bn |
| Lending | their money back, with interest | Regulation (EU) 2020/1503 (businesses) | $100.9bn* |
* All lending-based alternative finance, including loans that platforms fund from their own balance sheet. Real estate crowdfunding ($2.78bn) is counted separately.
Reward and donation are the crowdfunding almost everyone knows: backers support a project without making a profit from it. Equity and lending are investment crowdfunding, with European rules, licences and supervision.[8] This page covers all four, because that is the only way to see where each one stands.
The world: from $139 billion to $419 billion in two years, then the fall
In 2017 online alternative finance, Cambridge’s name for crowdfunding and peer-to-peer lending over the internet taken together, moved $419 billion. Three years later the figure was $113.7 billion.[1] Put like that, it looks like a collapse. It is not: almost all of the difference has one name, China.

Online alternative finance worldwide, 2015-2020
All models, billions of dollars. China and the rest of the world.
- Rest of the world
- China
Source: Cambridge Centre for Alternative Finance, global reports 2020 and 2021
See the data as a table
| Year | Rest of the world ($bn) | China ($bn) | Total ($bn) |
|---|---|---|---|
| 2015 | 44 | 95 | 139 |
| 2016 | 47 | 243 | 290 |
| 2017 | 60 | 359 | 419 |
| 2018 | 89.13 | 215.4 | 304.5 |
| 2019 | 91.36 | 84.35 | 175.7 |
| 2020 | 112.51 | 1.16 | 113.7 |
In 2017 China accounted for 86% of the global market, almost all of it peer-to-peer lending. At the peak, around 2015, the country had some 5,000 lending platforms according to its banking regulator. Then came the crackdown: by mid-November 2020 the number of platforms still operating was zero.[16] In August 2020 more than 800 billion yuan was still owed to investors.[17]
Take China out and the story turns the other way. The rest of the world grew from $44 billion in 2015 to $113 billion in 2020: up 157% in five years, growing every single year, pandemic year included (up 24%).[1] In 2020 the United States and Canada made up 65% of the total, the United Kingdom 11%, the rest of Europe 9% and Asia-Pacific excluding China 8%.
How much each model weighs
The crowdfunding that gets the most attention is among the smallest by volume. In 2020 lending accounted for almost nine dollars in every ten of online alternative finance. Reward and donation together made up 7.3%.
The weight of each model worldwide, 2020
Share of total online alternative finance ($113.7 billion).
- Reward$1.25bn1.1%
- Donation$7bn6.2%
- Equity and real estate$4.3bn3.8%
- Lending$100.86bn89%
- Other$260m0.2%
Source: Cambridge Centre for Alternative Finance, 2nd Global Benchmarking Report, table 1.4 (our grouping)
See the data as a table
| Model | Billions of dollars | Share |
|---|---|---|
| Reward | 1.25 | 1.1% |
| Donation | 7 | 6.2% |
| Equity and real estate | 4.3 | 3.8% |
| Lending | 100.86 | 88.7% |
| Other | 0.26 | 0.2% |
Weight in dollars, however, says nothing about how many people stand behind it. In the European Union a lending project raises about €240,000 on average[6], whereas a reward campaign lives on many small pledges. In Europe in 2015 a reward campaign attracted 85 backers on average, more than double the 33 of a donation campaign.[3]
Reward and donation worldwide
Between 2018 and 2020 reward-based crowdfunding grew from $877 million to $1.25 billion: up 43% in two years. Over the same period donation rose from $639 million to $7 billion.[1]
Reward and donation worldwide, 2018-2020
Millions of dollars.
- Reward
- Donation
Source: Cambridge Centre for Alternative Finance, global reports 2020 and 2021
See the data as a table
| Year | Reward ($m) | Donation ($m) |
|---|---|---|
| 2018 | 876.8 | 639.4 |
| 2019 | 897.3 | 2,680.6 |
| 2020 | 1,250.7 | 7,003.0 |
The leap in donation needs a careful reading. In 2019 and 2020 the United Kingdom alone accounted for between 77% and 82% of the donation volume recorded worldwide. Cambridge points to Captain Tom Moore’s fundraiser, £33 million for the NHS, but the jump begins before the pandemic and also depends on which platforms answered the survey. The centre itself warns that donation is significantly underestimated: Facebook and a large share of US fundraising are missing.[1]
Where reward-based crowdfunding happens
In 2020 the Americas were still in first place, but Asia-Pacific was catching up fast: in a single year reward crowdfunding in the region rose from $227 million to $414 million, up 82%. Europe came third.
Reward-based crowdfunding by region, 2020
Millions of dollars. Europe includes the United Kingdom; Asia-Pacific includes China.
- Americas$502.1m
- Asia-Pacific$413.6m
- Europe$330.5m
- Middle East and Africa$4.4m
Source: Cambridge Centre for Alternative Finance, 2nd Global Benchmarking Report, tables 1.12 and 1.13 (our sums)
A longer view reveals the shape of the sector. In the United States reward crowdfunding peaked in 2015, at $600 million; in Europe excluding Britain, in 2016. It then declined for a few years and picked up again in 2020. Cambridge explains the pause with three facts: some projects moved to equity and lending, which were better regulated; others moved to donation; and a number of pioneering platforms closed.[4]
| Year | United States | Europe excl. UK |
|---|---|---|
| 2014 | 460 | 159.9 |
| 2015 | 600 | 154.6 |
| 2016 | 550 | 211.1 |
| 2017 | 410 | 179.1 |
| 2018 | 380 | 175.4 |
| 2019 | 376 | 195 |
| 2020 | 471 | 262 |
Kickstarter, the iconic platform
Reward-based crowdfunding has an iconic platform, and its numbers show what the model has become. As of 21 January 2026, the last time it published complete statistics, Kickstarter counted $9.42 billion pledged by almost 25 million backers, 687,200 projects launched and 292,732 funded: a success rate of 42.74%. The average pledge was worth about $88.[10] The record belongs to a UV printer, the EufyMake E1: $46.76 million from 17,822 backers, in 2025.[11] We look at the numbers of reward crowdfunding in a separate article.
The country rankings
In 2020 the United States alone accounted for almost two thirds of the world’s online alternative finance. The surprise is in fourth place: Italy, with $1.86 billion, first in continental Europe.[1] Two years earlier it was fifteenth, with $533 million.[2]
Top 15 countries for online alternative finance, 2020
All models, millions of dollars.
- United States$73.62bn
- United Kingdom$12.64bn
- Brazil$5.32bn
- Italy$1.86bn
- India$1.71bn
- France$1.66bn
- Germany$1.48bn
- Indonesia$1.45bn
- South Korea$1.3bn
- China$1.16bn
- Australia$1.15bn
- Japan$1.14bn
- Singapore$963m
- Chile$804m
- Spain$674m
Source: Cambridge Centre for Alternative Finance, 2nd Global Benchmarking Report, appendix 1
See the data as a table
| Rank | Country | Millions of dollars |
|---|---|---|
| 1 | United States | 73,620 |
| 2 | United Kingdom | 12,643 |
| 3 | Brazil | 5,320 |
| 4 | Italy | 1,858 |
| 5 | India | 1,711 |
| 6 | France | 1,660 |
| 7 | Germany | 1,482 |
| 8 | Indonesia | 1,448 |
| 9 | South Korea | 1,304 |
| 10 | China | 1,161 |
| 11 | Australia | 1,152 |
| 12 | Japan | 1,141 |
| 13 | Singapore | 963 |
| 14 | Chile | 804 |
| 15 | Spain | 674 |
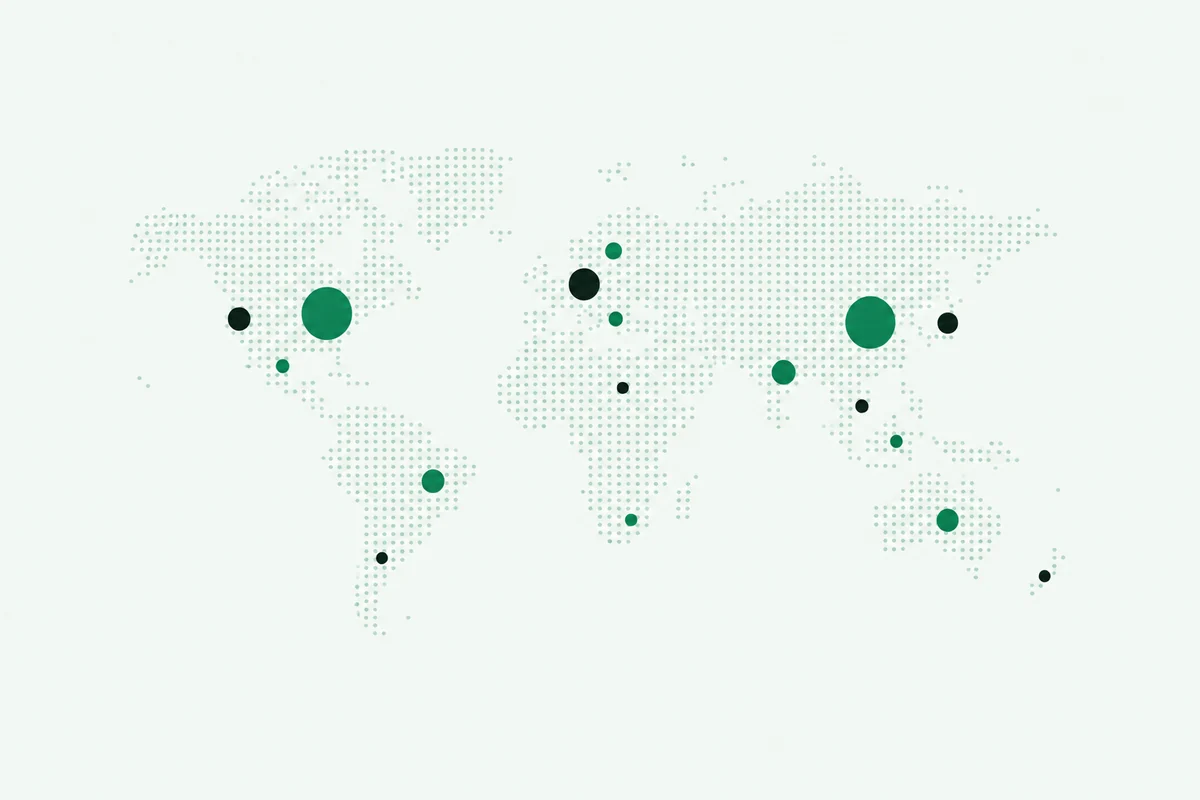
Italy’s leap does not come from rewards: almost all of it is credit to businesses. In 2020 Italy ranked first in Europe for invoice trading, the sale of invoices to investors through a platform, with $760 million, and second only to the United Kingdom in peer-to-peer business lending.[1] Brazil, in third place, has two different values in the same report ($3.37 billion and $5.32 billion): either way, it stays ahead of Italy.
Measured per head, the picture changes: small digital countries such as Latvia and Estonia rise to the top.
| Country | Rank | Dollars per head |
|---|---|---|
| United States | 1st | 222.42 |
| United Kingdom | 2nd | 186.23 |
| Singapore | 3rd | 164.66 |
| Latvia | 4th | 125.93 |
| Estonia | 5th | 114.13 |
| Netherlands | 16th | 32.68 |
| Italy | 17th | 30.72 |
| France | 20th | 25.43 |
| Germany | 26th | 17.69 |
| Spain | 27th | 14.41 |
Equity and lending: Europe, the United States, the United Kingdom
Since 10 November 2021 investment crowdfunding in Europe has followed a single rulebook, Regulation 2020/1503, with a transition period that ended on 10 November 2023.[8] It covers equity and business lending up to €5 million per project over twelve months. Reward and donation are outside its scope.
The most complete picture so far came from ESMA in December 2025: in 2024 181 platforms raised €4.25 billion across 21 countries. Loans made up 58%, debt securities 23% and equity 12%; 88% of investors were ordinary people, not professionals.[6] ESMA itself warns against comparing this figure with the roughly €1 billion of 2023, which was measured on a smaller sample.
Investment crowdfunding by platform country, 2024
The top five countries in the European Union, euros.
- France€1.45bn
- Netherlands€1bn
- Spain€450m
- Italy€290m
- Lithuania€280m
Source: ESMA, Market Report: Crowdfunding in the EU 2025
The ESMA register, consulted on 7 November 2026, lists 239 authorised and active platforms in 23 countries. France has 57, Italy 37. Germany, Europe’s largest economy, has just 3.[7]
| Country | Active platforms |
|---|---|
| France | 57 |
| Italy | 37 |
| Spain | 27 |
| Netherlands | 20 |
| Lithuania | 17 |
| Belgium | 10 |
| Romania | 8 |
| Germany | 3 |
United States
In the United States investment crowdfunding open to everyone has existed since 16 May 2016, under Regulation Crowdfunding. By 30 June 2026 there had been 9,851 offerings and $1.64 billion in reported proceeds. The peak came in 2022, with $328.9 million; since 2021 a company can raise up to $5 million a year, up from a previous limit of $1.07 million. The SEC points out that its totals are a lower bound: they only include issuers that report how much they raised.[9]
Regulation Crowdfunding in the United States, reported proceeds by year
Millions of dollars, 2016 (from 16 May) to 2025.
Source: U.S. Securities and Exchange Commission, 22 September 2026
See the data as a table
| Year | Millions of dollars |
|---|---|
| 2016 | 8.1 |
| 2017 | 45.1 |
| 2018 | 55.0 |
| 2019 | 61.7 |
| 2020 | 109.5 |
| 2021 | 259.7 |
| 2022 | 328.9 |
| 2023 | 292.6 |
| 2024 | 178.6 |
| 2025 | 207.3 |
United Kingdom
The United Kingdom was Europe’s laboratory. Equity crowdfunding grew from £3.9 million in 2012 to £333 million in 2017.[12] According to Beauhurst data it peaked in 2021, with £773 million across 569 deals, and fell to £324 million across 297 deals in 2024, the lowest number since 2014.[13] For peer-to-peer lending, the Financial Conduct Authority introduced stricter rules for retail investors from 9 December 2019.[14] In January 2022 Zopa, an online peer-to-peer lending pioneer since 2005, closed that service to focus on its bank.[15]
The big donation platforms
Measured in people, donation is the biggest crowdfunding in the world. GoFundMe, founded in 2010, reports more than $40 billion raised and a community of over 190 million people.[19] In 2025 it recorded 79 million donations: two and a half every second.[18]
GoFundMe, total raised since launch
Billions of dollars, cumulative as reported. From 2022 it includes fundraising for non-profit organisations.
Source: GoFundMe, annual reports 2020-2025
See the data as a table
| Year | Billions of dollars |
|---|---|
| 2015 | 1 |
| 2018 | 5 |
| 2021 | 15 |
| 2022 | 25 |
| 2024 | 30 |
| 2025 | 40 |
The cumulative totals in the chart come from GoFundMe’s annual reports,[23] and the series is not entirely like-for-like: since 2022 it has included donations to non-profit organisations and the Classy platform, acquired that year.[22] Part of the jump from $15 billion to $25 billion comes from there.[21]
Every year GoFundMe also publishes a ranking of the most generous countries, measured in donors per head. Ireland has topped it for seven years. Italy is in the top ten: seventh in 2020, tenth in 2025, with Milan the leading Italian city.[20][18]
| Rank | 2020 | 2025 |
|---|---|---|
| 1 | Ireland | Ireland |
| 2 | United States | United States |
| 3 | United Kingdom | United Kingdom |
| 4 | Canada | Australia |
| 5 | Australia | Canada |
| 6 | Netherlands | Netherlands |
| 7 | Italy | Germany |
| 8 | Luxembourg | Switzerland |
| 9 | Switzerland | Austria |
| 10 | Denmark | Italy |
A large share of these fundraisers is about health. A study published in JAMA Network Open counted 1,056,455 GoFundMe campaigns in the United States between 2010 and 2018: 26.7% were for medical expenses, and together they raised $3.66 billion.[24] In China the largest donation platform, Waterdrop, raises money for medical care only: 74.7 billion yuan from around 499 million people for 3.82 million patients.[27]
| Platform | Country | Reported total raised | As of |
|---|---|---|---|
| GoFundMe | United States | over $40bn | December 2025 |
| Waterdrop (medical expenses only) | China | 74.7bn yuan | June 2026 |
| JustGiving (for non-profits) | United Kingdom | over £7bn | November 2026 |
| betterplace.org | Germany | €374.6m | November 2026 |
| Rete del Dono | Italy | over €30m | June 2025 |
Sources: GoFundMe[19], Waterdrop[27], JustGiving[25], betterplace.org[26], Rete del Dono[28].
Italy: a closer look
Italy is worth a closer look for two reasons. In 2020 it ranked fourth in the world for online alternative finance and first in continental Europe, and almost all of that was lending to businesses, not rewards.[1] It is also one of the best-measured markets, thanks to the Politecnico di Milano observatory, which has tracked it since 2014.
Equity and business lending
From 2014 to June 2026 Italian equity crowdfunding raised €877.22 million. Of 1,712 closed campaigns, 1,412 reached their target: 82.5%. Business lending through platforms, which started in 2019, raised €717.93 million, and over the last three and a half years 99.2% of campaigns succeeded.[5]
Equity crowdfunding and business lending in Italy, by year
Millions of euros, by year the campaign closed. Lending has been measured since 2019.
- Equity
- Business lending
Source: Politecnico di Milano, 11th Italian Crowdinvesting Report, July 2026
See the data as a table
| Year | Equity (€m) | Business lending (€m) |
|---|---|---|
| 2014 | 1.31 | n/a |
| 2015 | 1.77 | n/a |
| 2016 | 4.28 | n/a |
| 2017 | 11.57 | n/a |
| 2018 | 36.61 | n/a |
| 2019 | 65.6 | 4.55 |
| 2020 | 101.04 | 45.02 |
| 2021 | 149.33 | 79.19 |
| 2022 | 142.37 | 117.74 |
| 2023 | 114.75 | 170.57 |
| 2024 | 112.58 | 161.11 |
| 2025 | 98.06 | 106.16 |
Equity peaked in 2021 at €149.33 million, lending in 2023 at €170.57 million. Then came the slowdown: in 2025 equity fell to €98.06 million and lending to €106.16 million, 34% less than the year before. From July 2025 to June 2026 total funding came to €164.19 million, 36.8% less than in the previous twelve months.[5] More than two thirds of the 2025 total went to real estate projects (our calculation on Politecnico data).
Italy had 37 authorised platforms on 30 June 2026, second in the European Union after France; 30 of them published at least one campaign in the last year.[5]
Reward and donation
Here the numbers are smaller, but they tell a story of real growth. In 2016 reward and donation crowdfunding raised €10.8 million in Italy. In 2025 it raised €45.4 million, more than four times as much. The record came in 2021, with €52.2 million, and since then the level has held between €43 million and €52 million a year.[5]
Reward and donation crowdfunding in Italy, by year
Millions of euros, the two models measured together.
Source: Politecnico di Milano, 11th Report (2016-2020 based on Starteed data)
See the data as a table
| Year | Millions of euros |
|---|---|
| 2016 | 10.8 |
| 2017 | 10.9 |
| 2018 | 18.8 |
| 2019 | 16.0 |
| 2020 | 31.1 |
| 2021 | 52.2 |
| 2022 | 52.3 |
| 2023 | 51.7 |
| 2024 | 43.1 |
| 2025 | 45.4 |
A note on reading the chart. Up to 2020 the data come from Starteed, which counted only platforms incorporated in Italy and left GoFundMe out.[29] From 2021 the Politecnico also estimates GoFundMe’s Italian share, which explains part of the jump between 2020 and 2021.[5]
Cambridge’s series for reward crowdfunding alone stops in 2017, and its last year carries a lesson on how much clear rules matter: Italian reward crowdfunding fell by 46%, which the centre put down to uncertainty over VAT on pre-sales.[4] Reward-based crowdfunding is outside EU Regulation 2020/1503 and follows consumer protection, e-commerce and VAT rules.[8]
What these numbers tell us
Taken together, the data tell five stories.
- Two markets share one name. Investment crowdfunding follows regulation and interest rates: it boomed and collapsed in China, partly retreated in the United Kingdom, and in Italy lost 36.8% in a year. Reward and donation follow people and communities, and move at a different pace.
- Reward grows slowly, but it holds. Worldwide it rose 43% between 2018 and 2020. In Italy reward and donation have quadrupled in nine years and have not dropped below €43 million since 2021.
- People take part, everywhere. GoFundMe recorded 79 million donations in 2025, two and a half every second, and its ranking of the most generous countries runs from Ireland to Italy, through the United States, the United Kingdom and the Netherlands.
- Reward is the crowdfunding of things that do not exist yet. An album, a book, a product, a festival: it is the model in which backers become a project’s first customers and first supporters, before it even exists.
- It is also the least measured. In Italy nobody has separated reward from donation since 2017, and the last global census dates from 2020. Every new figure here makes a difference.
In the big numbers of finance, reward is small. But it is the crowdfunding anyone can do, with any project.
How we worked
We used primary sources only: university reports, supervisory authorities, official platform data. We left out the “the market is worth X billion” estimates from market research firms, which often do not disclose their method. The limits, stated plainly:
- Cambridge’s global census stops in 2020 and relies on a voluntary survey: platforms that do not respond are not counted, and Cambridge itself considers reward and donation underestimated.
- Since 2023 ESMA has measured only the investment crowdfunding of authorised platforms.
- The Politecnico di Milano has changed the scope of its July-June series several times. That is why our charts use the calendar-year series from the 2026 Report, the only consistent one.
- Platform totals are self-reported and cannot be compared with one another.
- Currencies are those of the sources: dollars for Cambridge and the United States, euros for Europe and Italy. We did not convert anything. Figures marked as “ours” are our own calculations on published data.
The data are up to date as of 7 November 2026. This page is updated whenever new reports come out.
Frequently asked questions
How big is crowdfunding worldwide?
The latest global census, by the Cambridge Centre for Alternative Finance, counted $113.7 billion of online alternative finance in 2020, all models combined. Of this, $1.25 billion was reward-based crowdfunding and $7 billion donation-based crowdfunding. Since 2020 nobody has measured every model on a global scale.
How big is investment crowdfunding in Europe?
According to ESMA, the European Securities and Markets Authority, 181 authorised crowdfunding service providers raised €4.25 billion in the European Union in 2024, across 21 countries. Loans accounted for 58%, debt securities for 23% and equity for 12%; 88% of investors were ordinary people rather than professionals.
What is the most common type of crowdfunding?
By volume of money, lending: in 2020 it made up 88.7% of online alternative finance worldwide. Among the models in which backers receive no financial return, donation ($7 billion) is larger than reward ($1.25 billion).
Is reward-based crowdfunding covered by EU Regulation 2020/1503?
No. The regulation covers only investment crowdfunding and business lending. Reward-based crowdfunding follows e-commerce, VAT and consumer protection rules; donation-based crowdfunding has no dedicated rules.
How many crowdfunding platforms are authorised in the EU?
The ESMA register, consulted on 7 November 2026, lists 239 authorised and active crowdfunding service providers in 23 countries. France has the most, with 57, followed by Italy with 37. The licence covers investment crowdfunding and business lending; reward and donation platforms fall outside it.
Sources
- Cambridge Centre for Alternative Finance, The 2nd Global Alternative Finance Market Benchmarking Report, June 2021. jbs.cam.ac.uk/wp-content/uploads/2021/06/ccaf-2021-06-report-2nd-global-alternative-finance-benchmarking-study-report.pdf
- Cambridge Centre for Alternative Finance, The Global Alternative Finance Market Benchmarking Report, April 2020. jbs.cam.ac.uk/wp-content/uploads/2020/08/2020-04-22-ccaf-global-alternative-finance-market-benchmarking-report.pdf
- Cambridge Centre for Alternative Finance, Sustaining Momentum: The 2nd European Alternative Finance Industry Report, September 2016. jbs.cam.ac.uk/wp-content/uploads/2020/08/2016-european-alternative-finance-report-sustaining-momentum.pdf
- Cambridge Centre for Alternative Finance, Shifting Paradigms: The 4th European Alternative Finance Benchmarking Report, April 2019. jbs.cam.ac.uk/wp-content/uploads/2020/08/2019-05-4th-european-alternative-finance-benchmarking-industry-report-shifting-paradigms.pdf
- Osservatori Entrepreneurship Finance & Innovation, Politecnico di Milano, 11° Report italiano sul Crowdinvesting [11th Italian Crowdinvesting Report], July 2026. osservatoriefi.it/efi/download/11-report-italiano-sul-crowdinvesting
- ESMA, European Securities and Markets Authority, Market Report: Crowdfunding in the EU 2025, 22 December 2025. esma.europa.eu/sites/default/files/2025-12/ESMA50-481369926-30854_ESMA_Market_Report_Crowdfunding_in_the_EU_2025.pdf
- ESMA, Register of European crowdfunding service providers (accessed 7 November 2026). registers.esma.europa.eu/publication/searchRegister?core=esma_registers_upreg
- European Union, Regulation (EU) 2020/1503 on European crowdfunding service providers for business, 7 October 2020. eur-lex.europa.eu/legal-content/IT/TXT/?uri=CELEX:32020R1503
- U.S. Securities and Exchange Commission, Regulation CF Offerings: Number and Reported Proceeds, 22 September 2026. sec.gov/data-research/statistics-data-visualizations/regulation-crowdfunding-cf-offerings/regulation-cf-offerings-number-reported-proceeds
- Kickstarter, Kickstarter Stats (Internet Archive snapshot, 21 January 2026, the last complete version), 21 January 2026.
- Kickstarter, EufyMake's Printer Surges to $46.7 Million, Setting a New Crowdfunding Record, 24 June 2025.
- Cambridge Centre for Alternative Finance, The 5th UK Alternative Finance Industry Report, November 2018. jbs.cam.ac.uk/wp-content/uploads/2020/08/2018-5th-uk-alternative-finance-industry-report.pdf
- Crowdfund Insider (Beauhurst data), UK Investment Crowdfunding Deals Tanked in 2024: Why Did This Happen?, November 2025. crowdfundinsider.com/2025/11/255291-uk-investment-crowdfunding-deals-tanked-in-2024-why-did-this-happen
- Financial Conduct Authority, PS19/14: Loan-based (peer-to-peer) and investment-based crowdfunding platforms, feedback and final rules, June 2019. fca.org.uk/publications/policy-statements/ps19-14-loan-based-peer-to-peer-investment-based-crowdfunding-platforms-feedback-final-rules
- Zopa, An update on P2P at Zopa, December 2021.
- China Daily, China's P2P lenders fall to zero (statement by the China Banking and Insurance Regulatory Commission), 30 November 2020. global.chinadaily.com.cn/a/202011/30/WS5fc4b574a31024ad0ba98e57.html
- Caixin Global, China's 3-year crackdown leaves just 3 P2P lenders standing, 7 November 2020. caixinglobal.com/2020-11-07/chinas-3-year-crackdown-leaves-just-3-p2p-lenders-standing-101624086.html
- GoFundMe, 2025 Year in Help, December 2025.
- GoFundMe, About us.
- GoFundMe, 2020 Year in Help, December 2020.
- GoFundMe, 2021 Giving Report, December 2021.
- GoFundMe, 2022 Year in Help, December 2022.
- GoFundMe, 2024 Year in Help, 17 December 2024.
- JAMA Network Open, Angraal S. et al., Evaluation of Internet-Based Crowdsourced Fundraising to Cover Health Care Costs in the United States, 2021. jamanetwork.com/journals/jamanetworkopen/fullarticle/2774737
- JustGiving, About us.
- betterplace.org, Donation counter (read on 7 November 2026).
- Waterdrop Inc., Second Quarter 2026 Unaudited Financial Results, 8 September 2026. digital-release.wowktv.com/business/press-releases/cision/20260908CN42198/waterdrop-inc-announces-second-quarter-2026-unaudited-financial-results-and-a-cash-dividend
- Rete del Dono, Relazione di impatto 2025 [2025 Impact Report], June 2025.
- Starteed, Il Crowdfunding in Italia. Report 2020 [Crowdfunding in Italy: 2020 Report], January 2021. img.economyup.it/wp-content/uploads/2021/01/Crowdfunding_Report_2020.pdf