A board game, a comic, an album, a printer, a festival. Reward-based crowdfunding is how thousands of projects every year find their first backers before they even exist. Here are its numbers: how big it is, who wins, how much campaigns really raise, and what anyone preparing a campaign can learn from it all.
$9.42bn
pledged on Kickstarter from 2009 to January 2026
Kickstarter
42.74%
of Kickstarter projects reach their goal
Kickstarter
25m
backers on Kickstarter, one in three has come back to back again
Kickstarter
$88
the average pledge on Kickstarter; €53 on Ulule
Kickstarter, Ulule
$1.25bn
reward-based crowdfunding worldwide in 2020
Cambridge Centre for Alternative Finance
79%
of projects that pass 20% of their goal go on to succeed
Kickstarter
Reward-based crowdfunding
The crowdfunding model in which people who back a project get a reward in return: the finished product, a copy of the work, an experience, a thank-you. They do not get shares in the company or interest: they are buying in advance, or taking part in, something that is about to be born.
What reward-based crowdfunding is
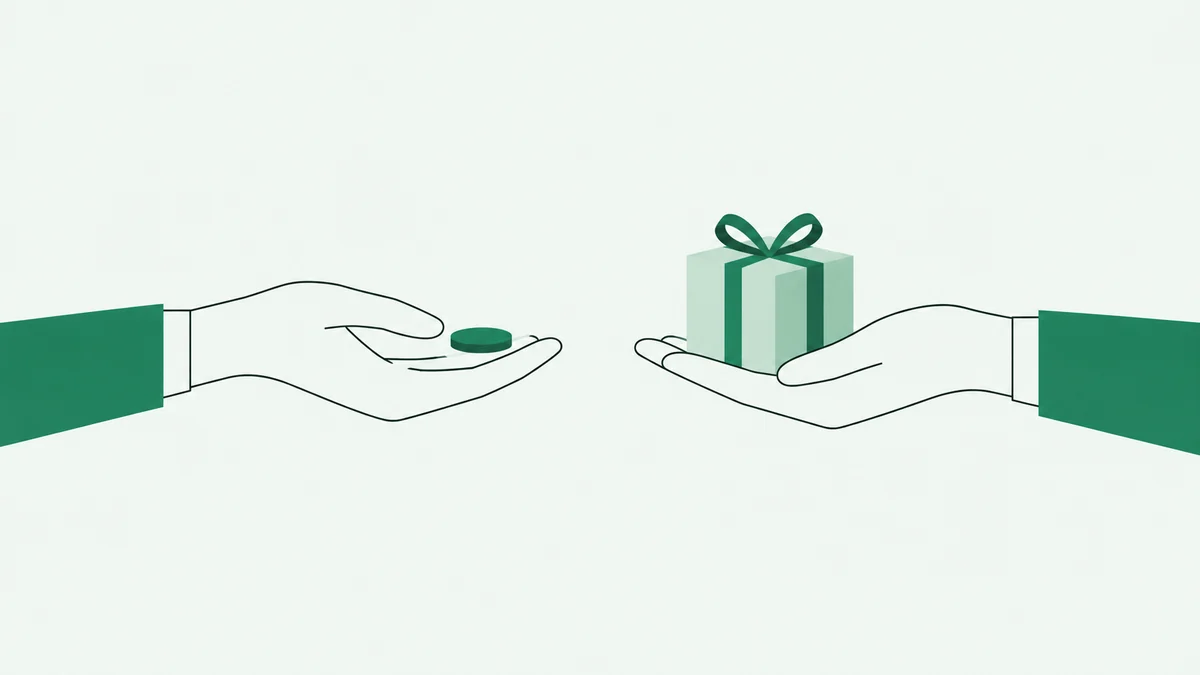
The deal is simple: you put the money in today, and the project gives you something tomorrow. For creators, it is a way to fund production without taking out a loan or giving away equity. For backers, it is a way to be first in line for something they love, often at a better price, and to be able to say “this exists partly thanks to me”.
Platforms split over one rule. Kickstarter works on “all or nothing”: if the campaign does not reach its goal, nobody pays and the project receives nothing. Other platforms let you keep what you raise, even below the goal. It is a choice that changes your whole strategy, and it is worth keeping in mind when you read the success rates below.
How big it is worldwide
The latest global survey, by the Cambridge Centre for Alternative Finance, counts $1.25 billion of reward-based crowdfunding in 2020, 43% more than in 2018.[22] The Americas accounted for $502 million, Asia-Pacific for 414 million and Europe for 331 million. It is a cautious figure: it is based on the platforms that answered the survey, and it has not been updated since 2020.
Reward-based crowdfunding worldwide, 2018-2020
Millions of dollars.
Source: Cambridge Centre for Alternative Finance, 2nd Global Benchmarking Report
See the data as a table
| Year | Millions of dollars |
|---|---|
| 2018 | 876.8 |
| 2019 | 897.3 |
| 2020 | 1,250.7 |
To follow the sector after 2020 you have to look inside the platforms, and the biggest one has been publishing its figures for years.
Kickstarter, from 2009 to today
Kickstarter was born in New York in 2009. In 2010 its projects raised $27.6 million, and in 2011 $99.3 million.[2] In 2012 the figure tripled: $319.8 million.[3] Then came $480 million in 2013[4] and $529 million in 2014.[5] In 2024 successful projects alone raised $706 million[6], and the platform called 2025 its best year ever for design and technology.[7]
On 21 January 2026, the last time Kickstarter published its full statistics before switching the page off, the total stood at $9.42 billion, from 24,989,816 backers: 8,727,478 of them had backed more than one project.[1]
Kickstarter, total pledged since launch
Billions of dollars at year end, all projects.
Source: Kickstarter Stats, year-end Internet Archive snapshots
See the data as a table
| Year end | Total pledged | Success rate |
|---|---|---|
| 2013 | $0.93bn | 43.71% |
| 2014 | $1.46bn | 39.82% |
| 2015 | $2.15bn | 36.47% |
| 2016 | $2.81bn | 35.8% |
| 2017 | $3.46bn | 35.93% |
| 2018 | $4.06bn | 36.63% |
| 2019 | $4.72bn | 37.49% |
| 2020 | $5.5bn | 38.36% |
| 2021 | $6.31bn | 39.39% |
| 2022 | $7.04bn | 40.29% |
| 2023 | $7.76bn | 41.14% |
| 2024 | $8.48bn | 41.95% |
| 2025 | $9.39bn | 42.73% |
The success rate tells a story of its own. In 2013 it stood at 43.7%; it fell to 35.8% in 2016, when far more projects were arriving on the platform, and has climbed every year since, up to 42.74% in 2026. Today more than four projects in ten reach their goal.
Categories: where projects win, where the money goes
Not every project has the same odds. Comics reach their goal almost seven times out of ten, dance and theatre six. At the bottom of the table sit journalism, technology and food, all below 26%.[1]
Kickstarter, success rate by category
Funded projects out of all projects launched, from 2009 to 21 January 2026.
- Comics68.8%
- Dance60.9%
- Theatre59.6%
- Games52.3%
- Music50.5%
- Art49.4%
- Design44.6%
- Publishing40%
- Film & Video38.3%
- Photography36.5%
- Fashion31.4%
- Crafts27.7%
- Food25.8%
- Technology24.9%
- Journalism23.7%
Source: Kickstarter Stats, 21 January 2026
See the data as a table
| Category | Projects launched | Success rate |
|---|---|---|
| Comics | 33,730 | 68.85% |
| Dance | 4,703 | 60.87% |
| Theatre | 13,765 | 59.58% |
| Games | 103,347 | 52.32% |
| Music | 72,414 | 50.51% |
| Art | 56,945 | 49.43% |
| Design | 60,554 | 44.63% |
| Publishing | 73,542 | 40% |
| Film & Video | 91,835 | 38.25% |
| Photography | 14,860 | 36.5% |
| Fashion | 42,633 | 31.39% |
| Crafts | 15,325 | 27.73% |
| Food | 37,235 | 25.76% |
| Technology | 59,615 | 24.94% |
| Journalism | 6,697 | 23.72% |
The money, though, follows a different ranking. Games, technology and design together took 73% of everything that went to successful projects. Technology is the most interesting case: it wins only one time in four, but when it wins, it raises a huge amount.
Kickstarter, where the money goes
Dollars raised by funded projects, by category, from 2009 to 21 January 2026.
- Games$2.71bn
- Technology$1.84bn
- Design$1.82bn
- Film & Video$524.72m
- Publishing$405.52m
- Comics$320.55m
- Music$288.12m
- Fashion$235.64m
- Art$220.33m
- Food$191.83m
- Photography$62.65m
- Theatre$49.52m
- Crafts$27.93m
- Journalism$20.04m
- Dance$15.64m
Source: Kickstarter Stats, 21 January 2026
See the data as a table
| Category | Dollars to funded projects |
|---|---|
| Games | $2,710m |
| Technology | $1,840m |
| Design | $1,820m |
| Film & Video | $524.72m |
| Publishing | $405.52m |
| Comics | $320.55m |
| Music | $288.12m |
| Fashion | $235.64m |
| Art | $220.33m |
| Food | $191.83m |
| Photography | $62.65m |
| Theatre | $49.52m |
| Crafts | $27.93m |
| Journalism | $20.04m |
| Dance | $15.64m |
How much a project really raises
The headlines talk about millions. Reality is smaller, and more encouraging: two out of three funded projects raise less than $10,000. In seventeen years only 994 projects have passed the million mark.[1] This is what reward-based crowdfunding mostly is: lots of human-sized campaigns that make it to the finish line.
Kickstarter, funded projects by amount raised
Number of projects, out of 292,732 funded.
- less than $1,00038,196
- $1,000-9,999153,438
- $10,000-19,99942,051
- $20,000-99,99945,001
- $100,000-999,99913,052
- $1 million and over994
Source: Kickstarter Stats, 21 January 2026
See the data as a table
| Amount raised | Projects | Share |
|---|---|---|
| less than $1,000 | 38,196 | 13% |
| $1,000-9,999 | 153,438 | 52.4% |
| $10,000-19,999 | 42,051 | 14.4% |
| $20,000-99,999 | 45,001 | 15.4% |
| $100,000-999,999 | 13,052 | 4.5% |
| $1 million and over | 994 | 0.3% |
On average, each individual pledge on Kickstarter is worth about $88: 106,959,487 pledges for $9.42 billion (our calculation from the platform's figures).[1] On Ulule the average pledge is €53.[15]
The 20% threshold
The most useful figure on this whole page is also the simplest. On Kickstarter, 79% of projects that pass 20% of their goal get funded.[1] And the projects that fail almost never come close: eight in ten stall below 20%.
Kickstarter, where unfunded projects stall
Percentage of the goal reached, out of 392,119 unfunded projects.
- 0% (no pledges)60,613
- 1-20%255,728
- 21-40%41,098
- 41-60%18,699
- 61-80%8,336
- 81-99%7,645
Source: Kickstarter Stats, 21 January 2026
See the data as a table
| Goal reached | Projects | Share |
|---|---|---|
| 0% (no pledges) | 60,613 | 15.5% |
| 1-20% | 255,728 | 65.2% |
| 21-40% | 41,098 | 10.5% |
| 41-60% | 18,699 | 4.8% |
| 61-80% | 8,336 | 2.1% |
| 81-99% | 7,645 | 1.9% |
Ethan Mollick, a professor at the Wharton School, had already spotted this in a study of more than 48,000 projects: campaigns tend to fail by large margins and succeed by small ones. Failed projects raised on average 10.3% of their goal; one successful project in four beat its goal by 3% or less.[11] In practice, campaigns are not decided on the last day. They are decided in the first few, when friends, family and the project's community push the total past that first threshold.
A campaign is won at the start. 20% of the goal is the point from which almost everyone makes it to the end.
The records
| Record | Campaign | Raised | Backers | Year |
|---|---|---|---|---|
| Most funded ever (Kickstarter) | EufyMake E1, UV printer | $46.76m | 17,822 | 2025 |
| Most backers ever (Kickstarter) | Exploding Kittens, card game | about $8.78m | 219,382 | 2015 |
| Most funded among verified campaigns (Indiegogo) | Flow Hive, beehive | $12.17m | 36,444 | 2015 |
| Most funded (Ulule) | Décarbonons la France ! | €4.63m | n/a | n/a |
EufyMake beat the previous Kickstarter record, a 2022 campaign by the author Brandon Sanderson, starting from a goal of just $500,000.[8] Exploding Kittens has held the record for the most people since 2015: 219,382.[10] On Indiegogo, Flow Hive, a beehive that pours honey straight from a tap, raised $12.17 million during its campaign.[14]
The other platforms around the world
Kickstarter is the biggest, but it is not alone. Indiegogo, part of Poland's Gamefound since July 2025, reports almost $3 billion raised and 38 million members.[12] In France, Ulule and KissKissBankBank, now a single group, have reached €576.7 million.[15] In Japan and Korea, reward crowdfunding is a full-blown industry: Makuake has passed 130 billion yen, CAMPFIRE 120 billion, and Korea's Wadiz 1,500 billion won.[16][17][18]
| Platform | Country | Reported total raised | Reported success rate | As of |
|---|---|---|---|---|
| Kickstarter | United States | $9.42bn | 42.74% | January 2026 |
| Indiegogo | United States | almost $3bn | n/a | July 2025 |
| Wadiz | South Korea | over ₩1,500bn | n/a | March 2026 |
| Makuake | Japan | over ¥130bn | n/a | August 2026 |
| CAMPFIRE | Japan | about ¥120bn | n/a | September 2026 |
| Ulule and KissKissBankBank | France | €576.7m | 78% | November 2026 |
| Startnext | Germany | €167.3m | n/a | November 2026 |
| Verkami | Spain | €71m | 75% | November 2026 |
| Produzioni dal Basso | Italy | €33.97m (including donations) | n/a | November 2026 |
Sources: Kickstarter[1], Indiegogo[12], Wadiz[18], Makuake[16], CAMPFIRE[17], Ulule[15], Startnext[19], Verkami[20], Produzioni dal Basso[21]. Indiegogo also reports more than 800,000 campaigns and more than 9 million backers since 2008.[13]
Six lessons for anyone planning a campaign
Put into practice, these numbers say six things.
- Choose a goal you can reach. Two successful campaigns out of three raise less than $10,000. A realistic goal you beat is better than an ambitious one you miss by a mile.
- Prepare the first few days. Projects that pass 20% make it to the end almost eight times out of ten. Before you launch, know who your first hundred backers will be.
- Make a video. In Mollick's study, all else being equal, having no video cut the chances of success by 26%.[11]
- Get the details right. Spelling mistakes lowered the chances by 13%, and so did not posting any updates in the first three days.[11]
- Give every stage a deadline. With “all or nothing”, short campaigns do better: Kickstarter recommends 30 days or less[9], and in its projects Mollick found that a longer duration, read as a sign of low confidence, reduced the chances of success.[11] With “keep it all” the rule changes shape: you can keep the campaign open for longer and use the money as it comes in, but it pays to split it into stages of a few weeks, each with a milestone, a date and some news to share. A deadline that is close gives your followers a reason to decide now.
- Plan your deliveries. In Mollick's sample more than 75% of projects delivered late, on average by just over a month. Fraud was extremely rare. Promising realistic dates is the best way to keep your backers for your next project too.[11]
How we worked
The Kickstarter figures come from the platform's official statistics page, which it switched off in early 2026: we use the last complete version, from 21 January 2026, preserved by the Internet Archive, and the year-end versions for the historical series. Kickstarter's success rates apply to “all or nothing” and cannot be compared with those of platforms that let creators keep what they raise. The other platforms' totals are as reported by the platforms themselves, in their own currencies, with no conversion on our part. Mollick's study covers 48,526 Kickstarter projects from 2009 to 2012: the percentages are estimates with all else being equal, not promises. The figures are up to date as of 7 November 2026.
Frequently asked questions
What is reward-based crowdfunding?
It is the crowdfunding model in which people who back a project get a reward in return: the finished product, a copy of the work, an experience, a thank-you. They do not get shares in the company or interest.
How many reward-based crowdfunding campaigns succeed?
On Kickstarter, the largest platform, 42.74% of the projects launched since 2009 have reached their goal (figures as of 21 January 2026). The rate varies a lot by category: from 68.85% for comics to 23.72% for journalism.
How much does a reward campaign raise on average?
Two out of three funded projects on Kickstarter raise less than $10,000. The average pledge is about $88 on Kickstarter and €53 on Ulule.
What is the most funded reward campaign ever?
According to Kickstarter it is the EufyMake E1, a UV printer, which raised $46.76 million from 17,822 backers in 2025. The record for backers belongs to Exploding Kittens, a card game: 219,382 people in 2015.
How long should a crowdfunding campaign last?
It depends on the funding model. With “all or nothing”, as on Kickstarter, the money only arrives at the end, and only if the goal is reached: that is why Kickstarter recommends 30 days or less, and a study of its projects (Mollick, 2014) found that longer campaigns are less likely to succeed. With “keep it all”, every pledge stays with the creator even below the goal, and a longer campaign becomes an ongoing fundraiser. It works if you split it into stages of a few weeks, each with a milestone, a date and some news to share.
Sources
- Kickstarter, Kickstarter Stats (Internet Archive snapshot, 21 January 2026, last complete version), 21 January 2026.
- Kickstarter, 2011: The Stats (with 2010 data), 9 January 2012.
- Kickstarter, The Best of Kickstarter 2012, January 2013.
- Kickstarter, The Year in Kickstarter 2013, January 2014.
- TechCrunch, Kickstarter's 2014 numbers, 6 January 2015. techcrunch.com/2015/01/06/kickstarter-2014-numbers
- Kickstarter, The Creative Download 2024, 6 March 2025.
- Kickstarter, A Year in Review: 2025 Kickstarter Highlights, 23 December 2025.
- Kickstarter, EufyMake's Printer Surges to $46.7 Million, Setting a New Crowdfunding Record, 24 June 2025.
- Kickstarter Help Center, What is the maximum project duration?.
- GeekWire, Exploding Kittens blows up Kickstarter as most-backed project of all time, 2015. geekwire.com/2015/exploding-kittens-blows-up-kickstarter-as-most-backed-project-of-all-time
- Journal of Business Venturing, Mollick E., The dynamics of crowdfunding: An exploratory study, 29(1), pp. 1-16, 2014. papers.ssrn.com/abstract=2088298
- PR Newswire, Gamefound Acquires Indiegogo, 24 July 2025. prnewswire.com/news-releases/gamefound-acquires-indiegogo-a-groundbreaking-leap-forward-for-global-creativity-and-creator-empowerment-302511967.html
- Indiegogo, Learn About Indiegogo (Internet Archive snapshot, 8 August 2025), August 2025.
- Indiegogo, Flow Hive: Honey on Tap Directly from Your Beehive, 2015.
- Ulule, Espace presse [Press area] (figures as of 6 November 2026) and statistics, 6 November 2026.
- Makuake, PR Times press release, Makuake, 13 years since launch, 26 August 2026. prtimes.jp/main/html/rd/p/000000343.000036381.html
- CAMPFIRE, CAMPFIRE 統計データ [Statistics], 26 October 2026.
- Wadiz, Wadiz official blog, 25 March 2026.
- Startnext, Homepage counters (read on 7 November 2026).
- Verkami, Sobre Verkami [About Verkami].
- Produzioni dal Basso, Homepage counters (read on 7 November 2026).
- Cambridge Centre for Alternative Finance, The 2nd Global Alternative Finance Market Benchmarking Report, June 2021. jbs.cam.ac.uk/wp-content/uploads/2021/06/ccaf-2021-06-report-2nd-global-alternative-finance-benchmarking-study-report.pdf